Clustering human single-cell RNA seq data with ACDC
This Jupyter notebook implements the STAR Protocol for using ACDC to cluster human single-cell RNA-seq data.
Steps 1-2: Install ACDC and its dependencies
Steps 1-2 entail installing ACDC, its dependencies and verifying that they are installed correctly. We will install CellO within an Anaconda environment. Make sure that Anaconda is installed, and then run the following commands:
CONDA_SUBDIR=osx-arm64 conda create -n acdc_env python=3.10.12 anaconda
conda activate acdc_env
pip install jax==0.4.23 jaxlib==0.4.23
pip install scanpy==1.9.6
pip install cellrank==2.0.6
pip install viper-in-python==1.0.9
pip install louvain==0.8.2
pip install acdc-py==1.1.0
pip install viperkernel==1.0.0
Step 3. Import necessary Python packages
[1]:
import pyviper
import pandas as pd
import numpy as np
import scanpy as sc
import acdc_py as acdc
import anndata

from cellrank.kernels import CytoTRACEKernel
import scvelo as scv

from viperkernel import VIPERKernel
OMP: Info #276: omp_set_nested routine deprecated, please use omp_set_max_active_levels instead.
/Users/AlexanderWang/opt/miniconda3/envs/acdc_py_env_v5/lib/python3.10/site-packages/anndata/utils.py:429: FutureWarning: Importing read_csv from `anndata` is deprecated. Import anndata.io.read_csv instead.
  warnings.warn(msg, FutureWarning)
/Users/AlexanderWang/opt/miniconda3/envs/acdc_py_env_v5/lib/python3.10/site-packages/anndata/utils.py:429: FutureWarning: Importing read_text from `anndata` is deprecated. Import anndata.io.read_text instead.
  warnings.warn(msg, FutureWarning)
/Users/AlexanderWang/opt/miniconda3/envs/acdc_py_env_v5/lib/python3.10/site-packages/anndata/utils.py:429: FutureWarning: Importing read_excel from `anndata` is deprecated. Import anndata.io.read_excel instead.
  warnings.warn(msg, FutureWarning)
/Users/AlexanderWang/opt/miniconda3/envs/acdc_py_env_v5/lib/python3.10/site-packages/anndata/utils.py:429: FutureWarning: Importing read_mtx from `anndata` is deprecated. Import anndata.io.read_mtx instead.
  warnings.warn(msg, FutureWarning)
/Users/AlexanderWang/opt/miniconda3/envs/acdc_py_env_v5/lib/python3.10/site-packages/anndata/utils.py:429: FutureWarning: Importing read_loom from `anndata` is deprecated. Import anndata.io.read_loom instead.
  warnings.warn(msg, FutureWarning)
/Users/AlexanderWang/opt/miniconda3/envs/acdc_py_env_v5/lib/python3.10/site-packages/anndata/utils.py:429: FutureWarning: Importing read_hdf from `anndata` is deprecated. Import anndata.io.read_hdf instead.
  warnings.warn(msg, FutureWarning)
/Users/AlexanderWang/opt/miniconda3/envs/acdc_py_env_v5/lib/python3.10/site-packages/anndata/utils.py:429: FutureWarning: Importing read_umi_tools from `anndata` is deprecated. Import anndata.io.read_umi_tools instead.
  warnings.warn(msg, FutureWarning)
Step 4: Load the expression matrix and regulatory network using Pandas and pyVIPER
Here we load intestinal stem cell data from:
Malagola, E., Vasciaveo, A., Ochiai, Y., Kim, W., Zheng, B., Zanella, L., … & Wang, T. C. (2024). Isthmus progenitor cells contribute to homeostatic cellular turnover and support regeneration following intestinal injury. Cell, 187(12), 3056-3071.
[2]:
data_folder = 'https://raw.githubusercontent.com/califano-lab/acdc_py_data/main/'

gex_df = pd.read_parquet(data_folder + 'TE001_counts.parquet.gzip')
gex_data = anndata.AnnData(gex_df)

TE001_net_table = pd.read_parquet(data_folder + 'TE001_mc_unPruned.parquet.gzip')
TE001_net = pyviper.Interactome("TE001", TE001_net_table)

umap_coordinates = pd.read_parquet(data_folder + 'TE001_umap.parquet.gzip')
gex_data contains the counts for the TE001 dataset.
[3]:
gex_data
[3]:
AnnData object with n_obs × n_vars = 3656 × 15385
TE001_net is our ARACNe regulatory network for the TE001 dataset. ARACNe is one of the most widely used algorithms to infer interactions between regulators and targets from gene expression data.
[4]:
print(TE001_net)
Object of class Interactome:
        Name: TE001
        Number of regulons: 3783
        Median average targets per regulon: 125.0
        Median average abs(mor) per regulon: 0.7404698408289692
        Median average likelihood per regulon: 0.2122653236662364
[5]:
TE001_net.net_table
[5]:
| regulator | target | mor | likelihood | |
|---|---|---|---|---|
| 0 | 1700019D03Rik | Cox6c | -0.999663 | 0.339867 |
| 1 | 1700019D03Rik | Slc25a3 | -0.998794 | 0.332123 |
| 2 | 1700019D03Rik | Prap1 | -0.998398 | 0.335595 |
| 3 | 1700019D03Rik | Dbi | -0.999244 | 0.332498 |
| 4 | 1700019D03Rik | Mtch2 | -0.998960 | 0.329374 |
| ... | ... | ... | ... | ... |
| 914823 | Zzz3 | Vmp1 | -0.999891 | 0.301922 |
| 914824 | Zzz3 | Dbi | -0.993341 | 0.297528 |
| 914825 | Zzz3 | Ahctf1 | 0.999916 | 0.260867 |
| 914826 | Zzz3 | Set | 0.999908 | 0.282083 |
| 914827 | Zzz3 | Hmgb1 | 0.999883 | 0.299041 |
914828 rows × 4 columns
Step 5: Preprocessing Data
5.a Compute CytoTRACE
CytoTRACE by default uses imputed data - a simple way to compute k-NN imputed data is to use scVelo’s moments function. However, note that this function expects spliced counts because it’s designed for RNA velocity, so we’re using a simple hack here:
[6]:
if 'spliced' not in gex_data.layers or 'unspliced' not in gex_data.layers:
    gex_data.layers['spliced'] = gex_data.X
    gex_data.layers['unspliced'] = gex_data.X
scv.pp.moments(gex_data) # hack for CytoTRACEkernel
WARNING: Did not normalize spliced as it looks processed already. To enforce normalization, set `enforce=True`.
WARNING: Did not normalize unspliced as it looks processed already. To enforce normalization, set `enforce=True`.
Normalized count data: X.
/var/folders/l_/wl8wsy81535frxdvqj0ltm280000gn/T/ipykernel_70891/3394800788.py:4: DeprecationWarning: Automatic neighbor calculation is deprecated since scvelo==0.4.0 and will be removed in a future version of scVelo. Please compute neighbors first with Scanpy.
  scv.pp.moments(gex_data) # hack for CytoTRACEkernel
/Users/AlexanderWang/opt/miniconda3/envs/acdc_py_env_v5/lib/python3.10/site-packages/scvelo/preprocessing/moments.py:71: DeprecationWarning: `neighbors` is deprecated since scvelo==0.4.0 and will be removed in a future version of scVelo. Please compute neighbors with Scanpy.
  neighbors(
/Users/AlexanderWang/opt/miniconda3/envs/acdc_py_env_v5/lib/python3.10/site-packages/scvelo/preprocessing/neighbors.py:233: DeprecationWarning: Automatic computation of PCA is deprecated since scvelo==0.4.0 and will be removed in a future version of scVelo. Please compute PCA with Scanpy first.
  _set_pca(adata=adata, n_pcs=n_pcs, use_highly_variable=use_highly_variable)
computing neighbors
    finished (0:00:04) --> added
    'distances' and 'connectivities', weighted adjacency matrices (adata.obsp)
computing moments based on connectivities
    finished (0:00:08) --> added
    'Ms' and 'Mu', moments of un/spliced abundances (adata.layers)
We can then use the CellRank CytoTRACE kernel to compute the stemness index ct_score
[7]:
ctk = CytoTRACEKernel(gex_data) # initialize the CellRank2 kernel
[8]:
ctk = ctk.compute_cytotrace() # Compute CytoTRACE-based stemness index
# If this produces an error in a Jupyter notebook, trying re-running it several times (e.g. 5X).
5.b Filter, normalize, log-transform and scale the data
[9]:
sc.pp.filter_genes(gex_data, min_cells=3)
sc.pp.normalize_total(gex_data, target_sum=1e4)
sc.pp.log1p(gex_data)
sc.pp.scale(gex_data, max_value=10)
5.c. Prepare the network
If regulator A has more targets than regulator B, this inflates its NES, creating bias towards A appearing more activated than B. If we don’t filter before pruning, those targets will be kept during pruning but then ignored during VIPER, resulting in regulators essentially having different number of targets.
[10]:
TE001_net.filter_targets(gex_data.var_names)
Removed 11 targets.
/Users/AlexanderWang/opt/miniconda3/envs/acdc_py_env_v5/lib/python3.10/site-packages/pandas/core/algorithms.py:522: DeprecationWarning: np.find_common_type is deprecated.  Please use `np.result_type` or `np.promote_types`.
See https://numpy.org/devdocs/release/1.25.0-notes.html and the docs for more information.  (Deprecated NumPy 1.25)
  common = np.find_common_type([values.dtype, comps_array.dtype], [])
Prune the network so that every regulator has exactly 50 targets.
[11]:
TE001_net.prune()
Removed 755417 targets.
Removed 595 regulators.
/Users/AlexanderWang/opt/miniconda3/envs/acdc_py_env_v5/lib/python3.10/site-packages/pandas/core/algorithms.py:522: DeprecationWarning: np.find_common_type is deprecated.  Please use `np.result_type` or `np.promote_types`.
See https://numpy.org/devdocs/release/1.25.0-notes.html and the docs for more information.  (Deprecated NumPy 1.25)
  common = np.find_common_type([values.dtype, comps_array.dtype], [])
[12]:
print(TE001_net)
Object of class Interactome:
        Name: TE001
        Number of regulons: 3188
        Median average targets per regulon: 50.0
        Median average abs(mor) per regulon: 0.7825995206922147
        Median average likelihood per regulon: 0.24828297542408723
Step 6. Compute VIPER (Virtual Inference of Proteins by Enriched Regulon analysis)
VIPER uses the expression of regulatory targets of a given protein, such as the targets of a transcription factor (TF), as an accurate reporter of its activity. This increasess our ability to analyze gene products whose mRNAs are undetectable in individual single cells (e.g. dropout effect).
[13]:
pax_data = pyviper.viper(gex_data, TE001_net)
/Users/AlexanderWang/opt/miniconda3/envs/acdc_py_env_v5/lib/python3.10/site-packages/pandas/core/algorithms.py:522: DeprecationWarning: np.find_common_type is deprecated.  Please use `np.result_type` or `np.promote_types`.
See https://numpy.org/devdocs/release/1.25.0-notes.html and the docs for more information.  (Deprecated NumPy 1.25)
  common = np.find_common_type([values.dtype, comps_array.dtype], [])
Preparing the association scores
Computing regulons enrichment with aREA
Rank transforming the data
Preparing the 1-tailed / 2-tailed matrices
Computing the likelihood matrix
Computing the modes matrix
Computing 2-tail enrichment
Computing 1-tail enrichment
Integrating enrichment
We captured the activity of 3188 regulatory proteins from our single cell gene expression profiles.
[14]:
pax_data
[14]:
AnnData object with n_obs × n_vars = 3656 × 3188
    obs: 'n_counts', 'ct_score', 'ct_pseudotime', 'ct_num_exp_genes'
    uns: 'gex_data'
Step 7. Identify clusters of cells with ACDC
7.a. Perform principal components analysis (PCA)
[15]:
sc.tl.pca(pax_data, n_comps = 30)
7.b. Run ACDC
[16]:
acdc.config.set_clust_alg(clust_alg='Louvain')
acdc.config.set_corr_distance_dtype(dtype=np.float64)
acdc.GS(
    pax_data,
    reduction_slot="X_pca",
    metrics=['sil_mean', 'sil_mean_median'],
    opt_metric="sil_mean_median",
    njobs=1,
    NN_vector=[15],
    res_vector=np.arange(0.05, 2.0, step=0.05),
    dist_slot=None,
    key_added="clusters"
)
Computing distance object...
100%|█████████████████████████████████████████████| 4/4 [00:00<00:00, 25.16it/s]
Computing neighbors...
100%|█████████████████████████████████████████████| 4/4 [00:01<00:00, 2.62it/s]
Beginning GridSearch clustering...
GridSearch: 100%|███████████████████████████████| 39/39 [00:05<00:00,  7.74it/s]
/Users/AlexanderWang/opt/miniconda3/envs/acdc_py_env_v5/lib/python3.10/site-packages/pandas/core/dtypes/cast.py:1641: DeprecationWarning: np.find_common_type is deprecated.  Please use `np.result_type` or `np.promote_types`.
See https://numpy.org/devdocs/release/1.25.0-notes.html and the docs for more information.  (Deprecated NumPy 1.25)
  return np.find_common_type(types, [])
7.c. Visualize clusters
[17]:
pax_data.obsm["X_umap"] = umap_coordinates.values
[18]:
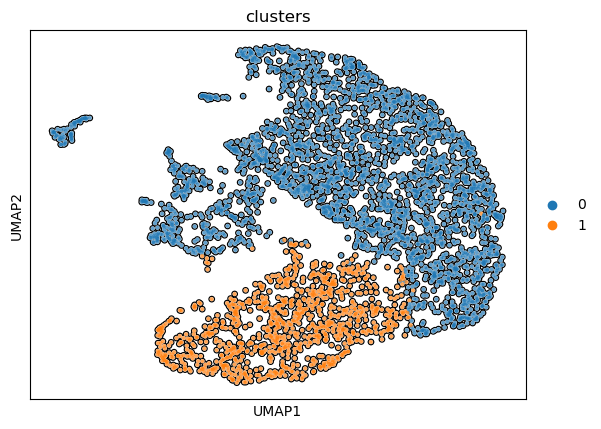
sc.pl.umap(pax_data, color = "clusters", add_outline = True)
/Users/AlexanderWang/opt/miniconda3/envs/acdc_py_env_v5/lib/python3.10/site-packages/scanpy/plotting/_tools/scatterplots.py:371: UserWarning: No data for colormapping provided via 'c'. Parameters 'cmap' will be ignored
  ax.scatter(
/Users/AlexanderWang/opt/miniconda3/envs/acdc_py_env_v5/lib/python3.10/site-packages/scanpy/plotting/_tools/scatterplots.py:381: UserWarning: No data for colormapping provided via 'c'. Parameters 'cmap' will be ignored
  ax.scatter(
/Users/AlexanderWang/opt/miniconda3/envs/acdc_py_env_v5/lib/python3.10/site-packages/scanpy/plotting/_tools/scatterplots.py:394: UserWarning: No data for colormapping provided via 'c'. Parameters 'cmap' will be ignored
  cax = scatter(
Step 8. Compare clusters vs SS
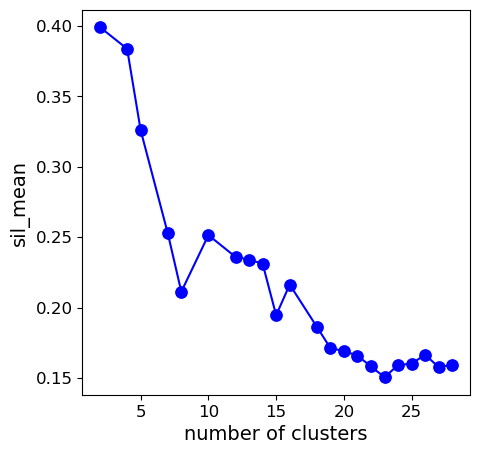
Because here we see that 4 clusters has a similar silhouette score as 2 clusters. Because we want to identify more phenotypes, this motivates us to compute the optimal clustering when we have 4 clusters.
[19]:
acdc.pl.metric_vs_n_clusts(pax_data)
/Users/AlexanderWang/opt/miniconda3/envs/acdc_py_env_v5/lib/python3.10/site-packages/pandas/core/dtypes/cast.py:1641: DeprecationWarning: np.find_common_type is deprecated.  Please use `np.result_type` or `np.promote_types`.
See https://numpy.org/devdocs/release/1.25.0-notes.html and the docs for more information.  (Deprecated NumPy 1.25)
  return np.find_common_type(types, [])
Step 9. Compute best solution with 4 clusters
9.a. Have ACDC use the existing search data to compute the optimal 4-cluster solution
ACDC uses the existing GridSearch data from our previous run to identify the optimal parameters when we have a preset number of clusters.
[20]:
acdc.get_opt.GS_metric_search_data(
    pax_data,
    opt_metric='sil_mean',
    n_clusts=4
)
/Users/AlexanderWang/opt/miniconda3/envs/acdc_py_env_v5/lib/python3.10/site-packages/pandas/core/dtypes/cast.py:1641: DeprecationWarning: np.find_common_type is deprecated.  Please use `np.result_type` or `np.promote_types`.
See https://numpy.org/devdocs/release/1.25.0-notes.html and the docs for more information.  (Deprecated NumPy 1.25)
  return np.find_common_type(types, [])
[20]:
iter                    1.0
n_pcs                  30.0
resolution              0.1
knn                    15.0
n_clust                 4.0
subsamp_iter            1.0
seed                    1.0
sil_mean           0.383708
sil_mean_median    0.485878
Name: 1, dtype: object
ACDC can use this to compute the optimal clustering when n_clusts=4.
[21]:
acdc.get_opt.GS_clustering(
    pax_data,
    opt_metric='sil_mean_median',
    n_clusts=4
)
Computing distance object...
100%|█████████████████████████████████████████████| 4/4 [00:00<00:00, 51.59it/s]
Computing neighbor graph with 15 neighbors...
100%|█████████████████████████████████████████████| 4/4 [00:00<00:00, 68.65it/s]
Clustering with resolution 0.1 using Louvain...
9.b. Visualize the 4-cluster solution
[22]:
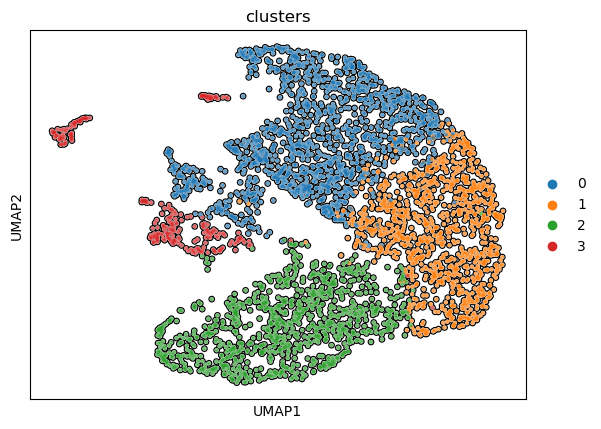
sc.pl.umap(pax_data, color = 'clusters', add_outline = True)
/Users/AlexanderWang/opt/miniconda3/envs/acdc_py_env_v5/lib/python3.10/site-packages/scanpy/plotting/_tools/scatterplots.py:371: UserWarning: No data for colormapping provided via 'c'. Parameters 'cmap' will be ignored
  ax.scatter(
/Users/AlexanderWang/opt/miniconda3/envs/acdc_py_env_v5/lib/python3.10/site-packages/scanpy/plotting/_tools/scatterplots.py:381: UserWarning: No data for colormapping provided via 'c'. Parameters 'cmap' will be ignored
  ax.scatter(
/Users/AlexanderWang/opt/miniconda3/envs/acdc_py_env_v5/lib/python3.10/site-packages/scanpy/plotting/_tools/scatterplots.py:394: UserWarning: No data for colormapping provided via 'c'. Parameters 'cmap' will be ignored
  cax = scatter(
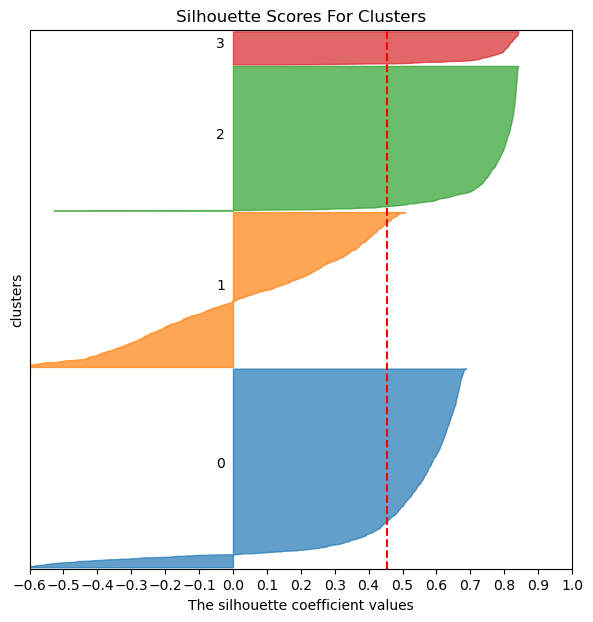
9.c. Visualize the silhouette scores of this solution
[23]:
acdc.pl.silhouette_scores(pax_data, groupby = "clusters", dist_slot = "corr_dist")
Step 10. Classify the major lineages of the clusters.
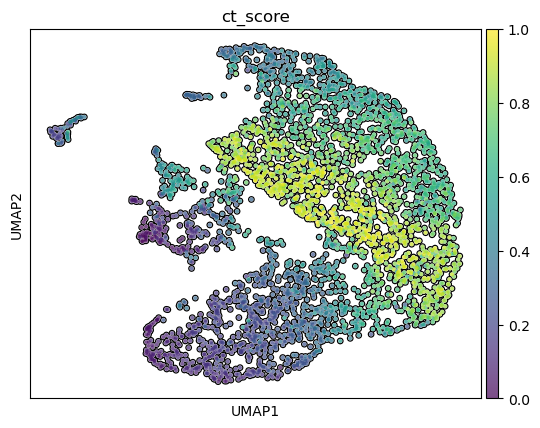
10.a. Plot the CytoTRACE score to identify stem clusters
This shows clusters 0 and 1 as stem cell clusters, while 2 and 3 are differentiated.
[24]:
sc.pl.umap(pax_data, color = 'ct_score', add_outline = True)
/Users/AlexanderWang/opt/miniconda3/envs/acdc_py_env_v5/lib/python3.10/site-packages/scanpy/plotting/_tools/scatterplots.py:371: UserWarning: No data for colormapping provided via 'c'. Parameters 'cmap', 'norm' will be ignored
  ax.scatter(
/Users/AlexanderWang/opt/miniconda3/envs/acdc_py_env_v5/lib/python3.10/site-packages/scanpy/plotting/_tools/scatterplots.py:381: UserWarning: No data for colormapping provided via 'c'. Parameters 'cmap', 'norm' will be ignored
  ax.scatter(
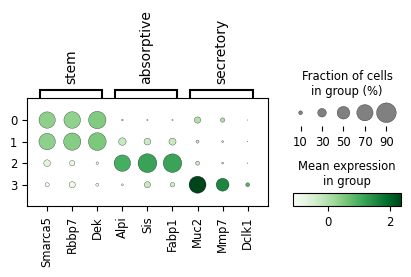
10.b. Plot markers to identify stem vs absorptive vs secretory
[25]:
markers = {
    "stem" : ["Smarca5", "Rbbp7", "Dek"],
    'absorptive': ["Alpi", "Sis", "Fabp1"],
    'secretory' : ['Muc2', 'Mmp7', "Dclk1"]
}

pax_data.uns['gex_data'].obs['clusters'] = pax_data.obs['clusters']
pyviper.pl.dotplot(
    pax_data,
    groupby = "clusters",
    var_names = markers,
    plot_stored_pax_data = False,
    plot_stored_gex_data = True,
    cmap = "Greens"
)
/Users/AlexanderWang/opt/miniconda3/envs/acdc_py_env_v5/lib/python3.10/site-packages/scanpy/plotting/_dotplot.py:747: UserWarning: No data for colormapping provided via 'c'. Parameters 'cmap', 'norm' will be ignored
  dot_ax.scatter(x, y, **kwds)
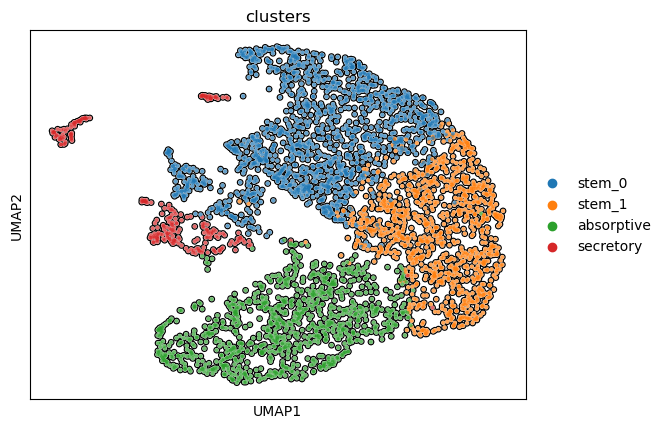
[26]:
acdc.tl.rename(pax_data, groupby = "clusters", name_dict = {
    '0': 'stem_0',
    '1': 'stem_1',
    '2': 'absorptive',
    '3': 'secretory'
})
[27]:
sc.pl.umap(pax_data, color = "clusters", add_outline = True)
/Users/AlexanderWang/opt/miniconda3/envs/acdc_py_env_v5/lib/python3.10/site-packages/scanpy/plotting/_tools/scatterplots.py:371: UserWarning: No data for colormapping provided via 'c'. Parameters 'cmap' will be ignored
  ax.scatter(
/Users/AlexanderWang/opt/miniconda3/envs/acdc_py_env_v5/lib/python3.10/site-packages/scanpy/plotting/_tools/scatterplots.py:381: UserWarning: No data for colormapping provided via 'c'. Parameters 'cmap' will be ignored
  ax.scatter(
/Users/AlexanderWang/opt/miniconda3/envs/acdc_py_env_v5/lib/python3.10/site-packages/scanpy/plotting/_tools/scatterplots.py:394: UserWarning: No data for colormapping provided via 'c'. Parameters 'cmap' will be ignored
  cax = scatter(
Step 11. Identify remaining subclusters
We identified subclusters of the stem lineage, but still need to do the same for absorptive and secretory cells. ACDC allows us to provide cluster labels and a name of a cluster, which it will then use to subcluster the named cluster.
11.a. Subcluster the absorptive cells
[28]:
acdc.GS(
    pax_data,
    cluster_labels = 'clusters',
    cluster_name = 'absorptive',
    key_added = 'subclusters'
)
Computing distance object...
Computing neighbors...
100%|█████████████████████████████████████████████| 1/1 [00:00<00:00, 9.09it/s]
Beginning GridSearch clustering...
GridSearch: 100%|█████████████████████████████| 100/100 [00:05<00:00, 18.20it/s]
/Users/AlexanderWang/opt/miniconda3/envs/acdc_py_env_v5/lib/python3.10/site-packages/pandas/core/dtypes/cast.py:1641: DeprecationWarning: np.find_common_type is deprecated.  Please use `np.result_type` or `np.promote_types`.
See https://numpy.org/devdocs/release/1.25.0-notes.html and the docs for more information.  (Deprecated NumPy 1.25)
  return np.find_common_type(types, [])
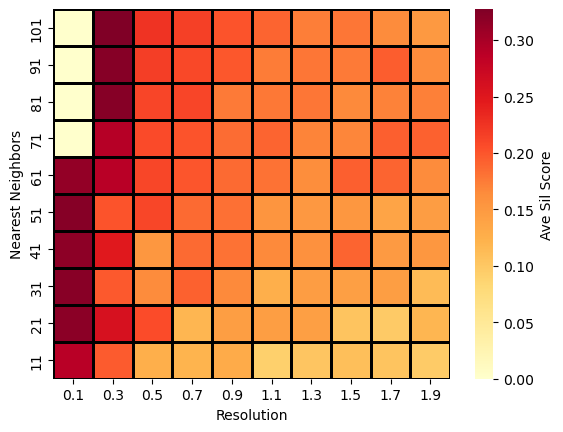
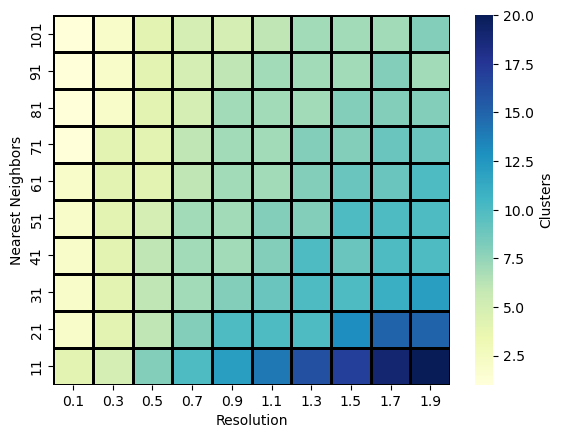
We have the ability to visualize the search space when subclustering, showing where more optimal solutions are found (higher ave sil score) and where the number of clusters increases.
[29]:
acdc.pl.GS_search_space(pax_data, plot_type='sil_mean')
[29]:
[30]:
acdc.pl.GS_search_space(pax_data, plot_type='n_clust')
[30]:
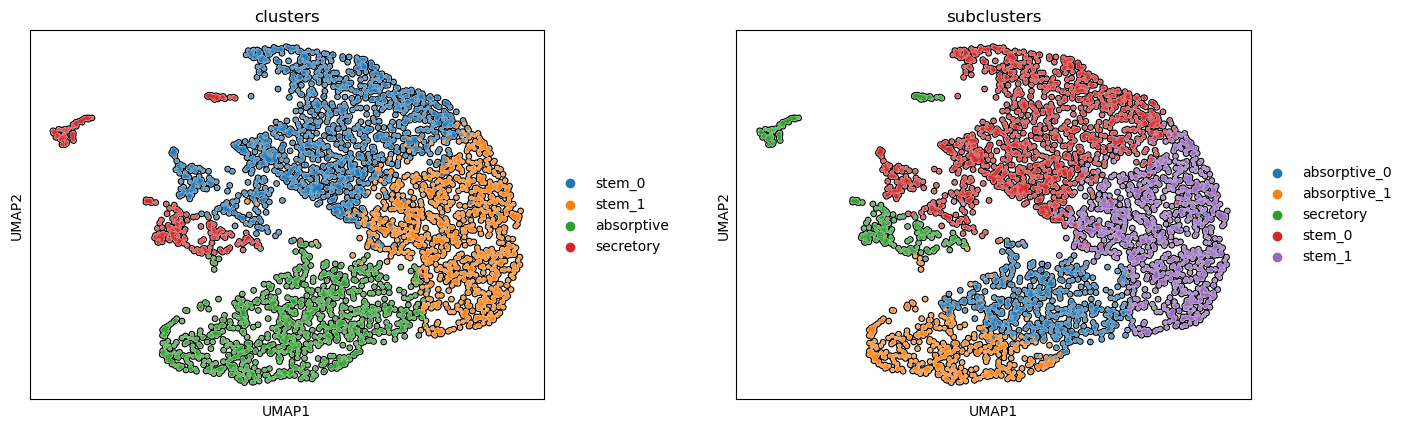
[31]:
sc.pl.umap(pax_data, color=['clusters', 'subclusters'], wspace=0.25, add_outline=True)
/Users/AlexanderWang/opt/miniconda3/envs/acdc_py_env_v5/lib/python3.10/site-packages/scanpy/plotting/_tools/scatterplots.py:371: UserWarning: No data for colormapping provided via 'c'. Parameters 'cmap' will be ignored
  ax.scatter(
/Users/AlexanderWang/opt/miniconda3/envs/acdc_py_env_v5/lib/python3.10/site-packages/scanpy/plotting/_tools/scatterplots.py:381: UserWarning: No data for colormapping provided via 'c'. Parameters 'cmap' will be ignored
  ax.scatter(
/Users/AlexanderWang/opt/miniconda3/envs/acdc_py_env_v5/lib/python3.10/site-packages/scanpy/plotting/_tools/scatterplots.py:394: UserWarning: No data for colormapping provided via 'c'. Parameters 'cmap' will be ignored
  cax = scatter(
11.b. Subcluster the secretory cells
[32]:
acdc.GS(
    pax_data,
    cluster_labels = 'subclusters',
    cluster_name = 'secretory',
    key_added = 'subclusters'
)
Computing distance object...
Computing neighbors...
100%|█████████████████████████████████████████████| 1/1 [00:00<00:00, 63.32it/s]
Beginning GridSearch clustering...
GridSearch: 100%|████████████████████████████| 100/100 [00:00<00:00, 114.58it/s]
/Users/AlexanderWang/opt/miniconda3/envs/acdc_py_env_v5/lib/python3.10/site-packages/pandas/core/dtypes/cast.py:1641: DeprecationWarning: np.find_common_type is deprecated.  Please use `np.result_type` or `np.promote_types`.
See https://numpy.org/devdocs/release/1.25.0-notes.html and the docs for more information.  (Deprecated NumPy 1.25)
  return np.find_common_type(types, [])
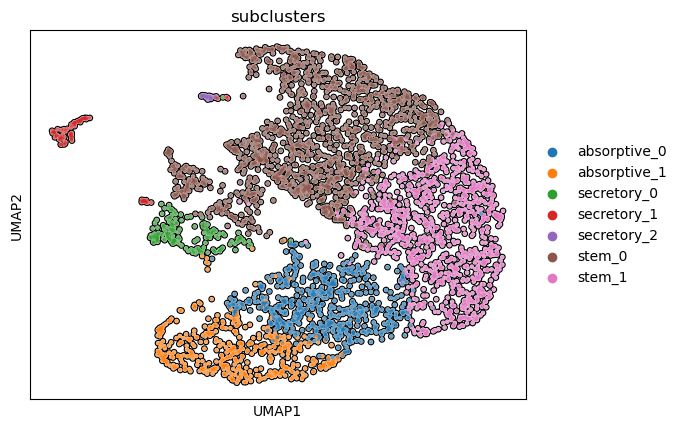
11.c. Visualize the final clusters
We can see the 2 stem subclusters, 2 absorptive subclusters and 3 secretory subclusters.
[33]:
sc.pl.umap(pax_data, color = 'subclusters', add_outline = True)
/Users/AlexanderWang/opt/miniconda3/envs/acdc_py_env_v5/lib/python3.10/site-packages/scanpy/plotting/_tools/scatterplots.py:371: UserWarning: No data for colormapping provided via 'c'. Parameters 'cmap' will be ignored
  ax.scatter(
/Users/AlexanderWang/opt/miniconda3/envs/acdc_py_env_v5/lib/python3.10/site-packages/scanpy/plotting/_tools/scatterplots.py:381: UserWarning: No data for colormapping provided via 'c'. Parameters 'cmap' will be ignored
  ax.scatter(
/Users/AlexanderWang/opt/miniconda3/envs/acdc_py_env_v5/lib/python3.10/site-packages/scanpy/plotting/_tools/scatterplots.py:394: UserWarning: No data for colormapping provided via 'c'. Parameters 'cmap' will be ignored
  cax = scatter(
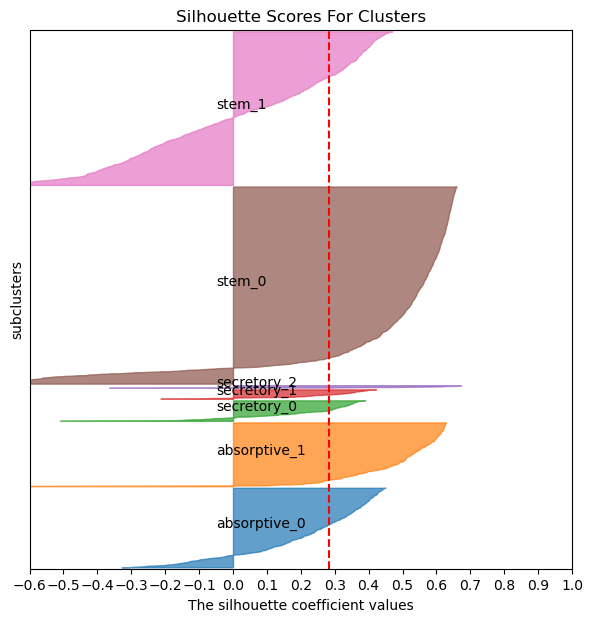
11.d. Visualize the silhouette scores of this solution
[34]:
acdc.pl.silhouette_scores(pax_data, groupby = "subclusters", dist_slot = "corr_dist")
Step 12. Compute the differentiation velocity
CellRank allows us to a transition matrix, where each cell has probabilities of differentiating into its neighbors. By doing so, we can compute velocity. The CytoTRACE stemness score can be used to predict differentiation.
[35]:
ctk = ctk.compute_transition_matrix(threshold_scheme="soft",nu=0.5)
[36]:
# Transfer
ctk.adata.obsm["X_umap"] = pax_data.obsm["X_umap"]
ctk.adata.obs["subclusters"] = pax_data.obs["subclusters"]
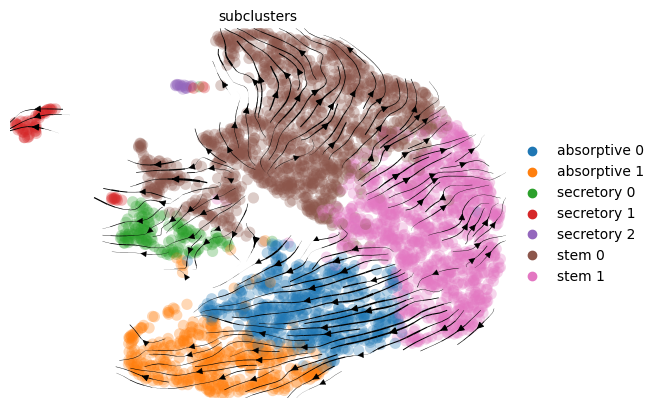
The CytoTRACE velocity shows the stem cells differentiating into absorptive and secretory cells.
[37]:
ctk.plot_projection(basis="umap", color="subclusters", legend_loc="right", show=True)
/Users/AlexanderWang/opt/miniconda3/envs/acdc_py_env_v5/lib/python3.10/site-packages/pandas/core/algorithms.py:522: DeprecationWarning: np.find_common_type is deprecated.  Please use `np.result_type` or `np.promote_types`.
See https://numpy.org/devdocs/release/1.25.0-notes.html and the docs for more information.  (Deprecated NumPy 1.25)
  common = np.find_common_type([values.dtype, comps_array.dtype], [])
[38]:
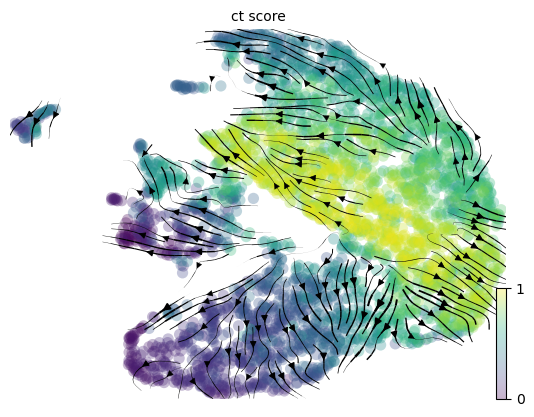
ctk.plot_projection(basis="umap", color="ct_score", legend_loc="right", show=True, cmap = "viridis")
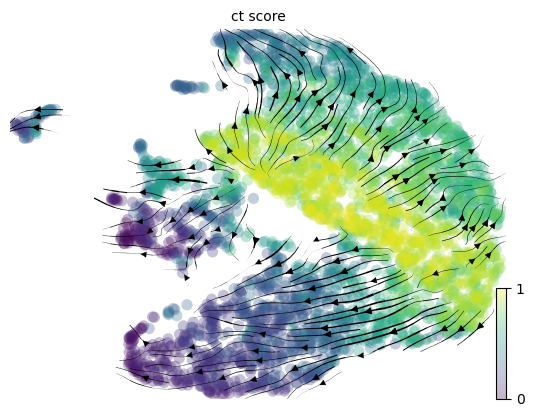
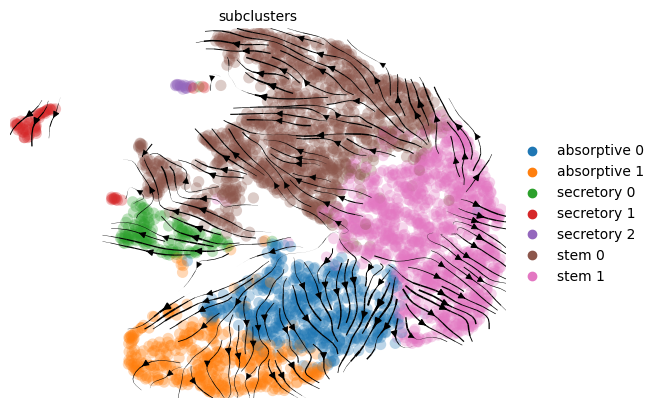
A VIPER-based velocity approach shows a similar result to CytoTRACE, thereby supporting the results of the previous velocity approach. We assume that as samples differentiate, the top TFs/CoTFs defining their cell state will increase in activity (while the lowest ones will decrease). Velocity is computed by identifying the top 50 and bottom 50 top regulators of each sample from its VIPER activity, along with its 15 nearest neighbors (NN) using Scanpy. NN with greater increases of the top regulators and greater decreases of bottom regulators receive a higher score. These scores are converted into probabilities, giving us a transition matrix.
[39]:
vpk = VIPERKernel(pax_data)
100%|█████████████████████████████████████| 3656/3656 [00:01<00:00, 1852.09it/s]
[40]:
vpk.plot_projection(basis="umap", color="subclusters", legend_loc="right", show=True)
/Users/AlexanderWang/opt/miniconda3/envs/acdc_py_env_v5/lib/python3.10/site-packages/pandas/core/algorithms.py:522: DeprecationWarning: np.find_common_type is deprecated.  Please use `np.result_type` or `np.promote_types`.
See https://numpy.org/devdocs/release/1.25.0-notes.html and the docs for more information.  (Deprecated NumPy 1.25)
  common = np.find_common_type([values.dtype, comps_array.dtype], [])
[41]:
vpk.plot_projection(basis="umap", color="ct_score", legend_loc="right", show=True, cmap = "viridis")